Description

Disclaimer: Copyright infringement not intended.
Context:
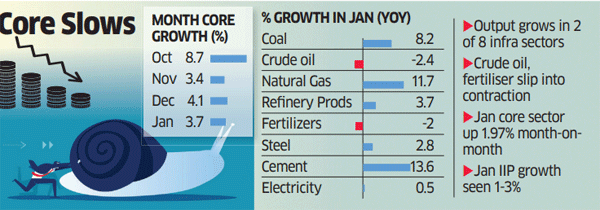
- The combined Index of Eight Core Industries stood at 144.4 in January 2022, which increased by 3.7 per cent (provisional) as compared to the Index of January 2021.
Findings:
- The production of Coal, Natural Gas, Refinery Products, Steel, Cement and Electricity industries increased in January 2022over the corresponding period of last year.
- Final growth rate of Index of Eight Core Industries for October 2021 has been revised to 8.7%.
- The growth rate of ICI during April-January 2021-22 was 11.6% (P) as compared to the corresponding period of last FY.
About:
- The Office of Economic Adviser, Department for Promotion of Industry and Internal Trade releases Index of Eight Core Industries (ICI).
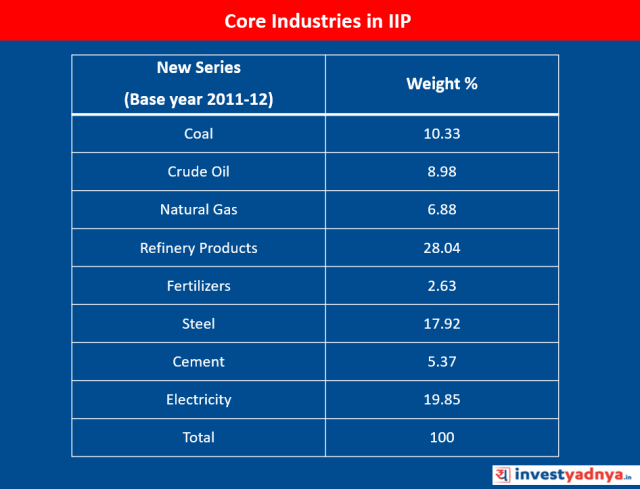
- ICI measures combined and individual performance of production in selected eight core industries viz. Coal, Crude Oil, Natural Gas, Refinery Products, Fertilizers, Steel, Cement and Electricity.
- The Eight Core Industries comprise 40.27% of the weight of items included in the Index of Industrial Production (IIP).
Index of Industrial Production data or IIP:
- It is an index that tracks manufacturing activity in different sectors of an economy.
- The IIP number measures the industrial production for the period under review, usually a month, as against the reference period.
- IIP is a key economic indicator of the manufacturing sector of the economy.
- There is a lag of six weeks in the publication of the IIP index data after the reference month ends. IIP index is currently calculated using 2011-2012 as the base year.
IIP Index Components:
- Electricity, crude oil, coal, cement, steel, refinery products, natural gas, and fertilisers are the eight core industries that comprise about 40 percent of the weight of items included in the Index of Industrial Production.
- Mining, manufacturing, and electricity are the three broad sectors in which IIP constituents fall.
Who releases Index of Industrial Production or IIP data?
- In the case of Index of Industrial Production India, IIP data is compiled and published by CSO every month.
- CSO or Central Statistical Organisation operates under the Ministry of Statistics and Programme Implementation (MoSPI).
Who uses IIP data?
- The factory production data (IIP) is used by various government agencies such as the Ministry of Finance, the Reserve Bank of India (RBI), private firms and analysts, among others for analytical purposes.
- The data is also used to compile the Gross Value Added (GVA) of the manufacturing sector in the Gross Domestic Product (GDP) on a quarterly basis.
IIP base year change:
- The base year was changed to 2011-12 from 2004-05 in the year 2017.
- The earlier base years were 1937, 1946, 1951, 1956, 1960, 1970, 1980-81, 1993-94 and 2004-05.
Where is IIP data sourced from?
- The CSO uses secondary data to reach the monthly IIP number.
- The data is sourced from various agencies in different ministries or departments of the government.
- The Department of Industrial Policy and Promotion (DIPP) is the source for the major chunk of data for the calculation.
IIP vs ASI:
- While the IIP is a monthly indicator, the Annual Survey of Industries (ASI) is the prime source of long-term industrial statistics.
- The ASI is used to track the health of the industrial activity in the economy over a longer period.
- The index is compiled out of a much larger sample of industries compared to IIP.
https://pib.gov.in/PressReleasePage.aspx?PRID=1801828


