Copyright infringement not intended
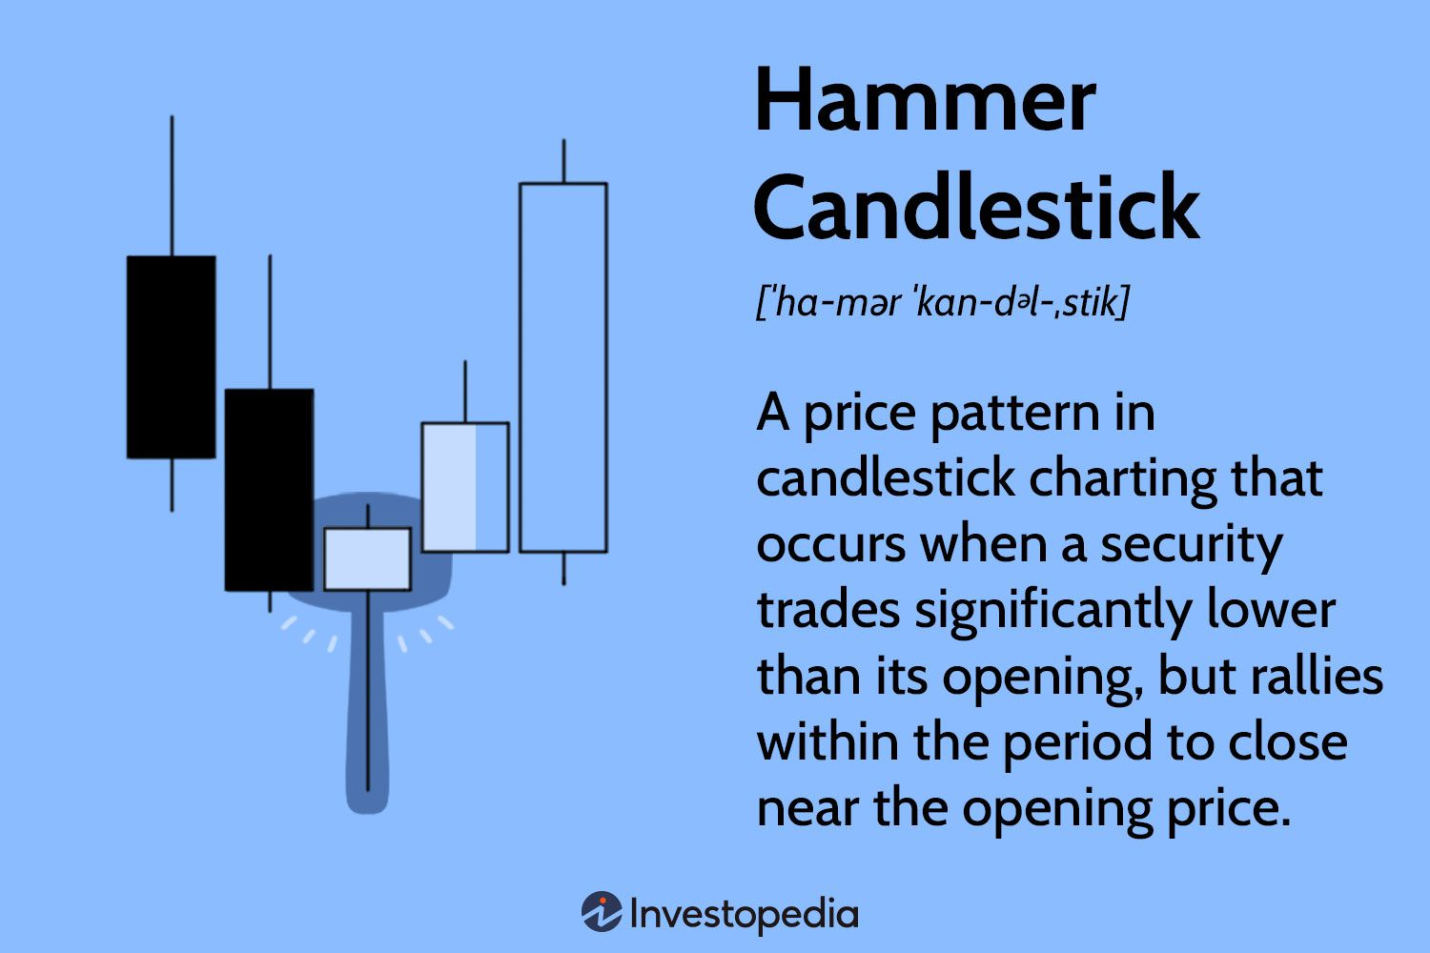
Picture Courtesy: www.investopedia.com
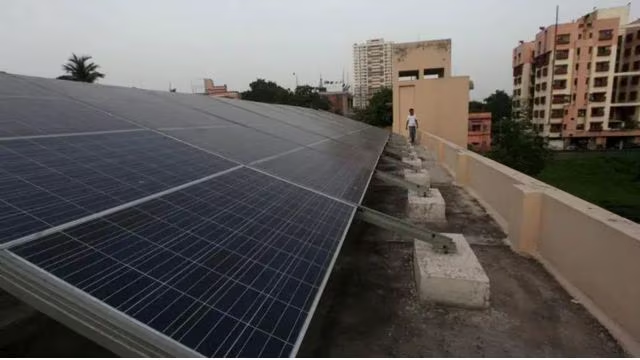
Context: Nifty has surpassed the 19,850 hurdle and formed a hammer candlestick pattern. Analysts suggest that a sustainable move above 19,900 levels could lead to Nifty reaching new all-time highs.
What Is a Hammer Candlestick?

To confirm a hammer candlestick, traders should look for the following criteria:
A hammer candlestick is not a guarantee that the price will reverse, but it provides a strong signal that the trend may change. Traders should use other technical indicators and market context to validate the hammer candlestick and enter a trade accordingly. For example, traders can look for a bullish confirmation candlestick, such as a green engulfing or piercing pattern, in the next trading session. Alternatively, traders can use volume, moving averages, trend lines, or other tools to confirm the reversal.

Conclusion
|
PRACTICE QUESTION Q. What does a hammer candlestick pattern suggest about market sentiment? A. Strong bearish trend B. Potential reversal to the upside C. Continuation of the current trend D. Indecisive market conditions Answer: B Explanation: A hammer candlestick typically occurs after a price decline, signalling a potential shift from bearish to bullish sentiment. |


© 2025 iasgyan. All right reserved