Description
Disclaimer: Copyright infringement not intended.
Context
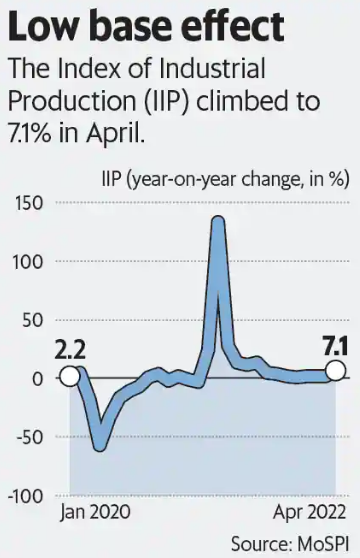
- Industrial output rose to an eight-month high of 7.1% in April 2022 on the back of improved performance by the power and mining sectors, as per government data.
Index of Industrial Production
- The Index of Industrial Production (IIP) is an index which shows the growth rates in different industry groups of the economy in a stipulated period of time.
- More formally, it chooses a basket of industrial products — ranging from the manufacturing sector to mining to energy, creates an index by giving different weight to each sector and then tracks the production every month.
- Finally, the index value is compared to the value it had in the same month last year to figure out the economy’s industrial health.
- The IIP number measures the industrial production for the period under review, usually a month, as against the reference period.
Who releases Index of Industrial Production or IIP data?
- The IIP is estimated and published on a monthly basis by the Central Statistical Organisation (CSO) .
- As an all India index, it gives general level of industrial activity in the economy.
IIP base year/ Reference Period
- The IIP base year was changed to 2011-12 from 2004-05 in the year 2017.
- The earlier base years were 1937, 1946, 1951, 1956, 1960, 1970, 1980-81, 1993-94 and 2004-05.
Where is IIP data sourced from?
- The CSO uses secondary data to reach the monthly IIP number.
- The data is sourced from various agencies in different ministries or departments of the government.
- The Department of Industrial Policy and Promotion (DIPP)is the source for the major chunk of data for the calculation.
Who uses IIP data?
- The factory production data (IIP) is used by various government agencies such as the Ministry of Finance, the Reserve Bank of India (RBI), private firms and analysts, among others for analytical purposes.
- The data is also used to compile the Gross Value Added (GVA) of the manufacturing sector in the Gross Domestic Product (GDP) on a quarterly basis.
Calculation of IIP:
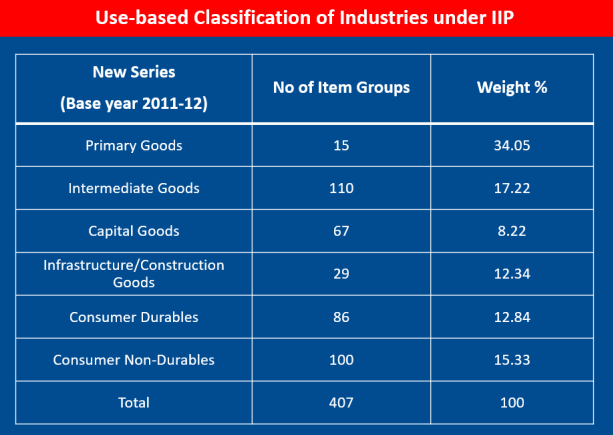
IIP is a composite indicator that measures the growth rate of industry groups classified under,
- Broad sectors, namely, Mining, Manufacturing and Electricity
- Use-based sectors, namely Primary/Basic Goods, Capital Goods, Intermediate Goods, Consumer durables etc.
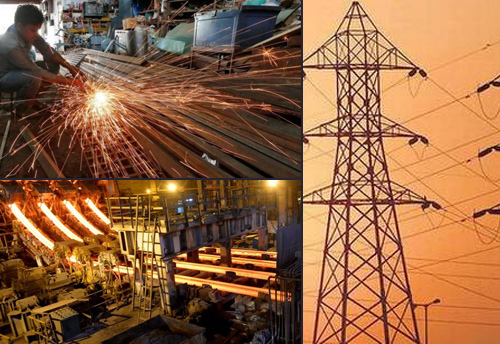
Core Industries in IIP
- The main or the key industries constitute the core sectors of an economy.
- In India, there are eight sectors that are considered the core sectors.
- The eight industries have a combined share of 40.27 per cent in the Index of Industrial Production (IIP), which gives the growth rates of different industry groups in a specified period.
- The eight-core sectors of the Indian economy are electricity, steel, refinery products, crude oil, coal, cement, natural gas and fertilizers.
- These sectors have a major impact on the Indian economy and significantly affect most other industries as well.
- The Office of Economic Adviser, Department for Promotion of Industry and Internal Trade releases Index of Eight Core Industries (ICI).
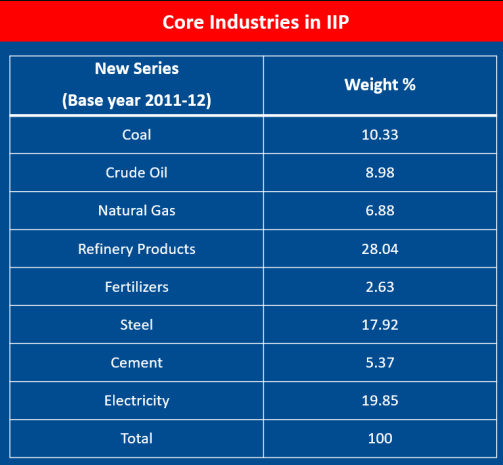
The Eight Core Industries in decreasing order of their Weightage:
Refinery Products> Electricity> Steel> Coal> Crude Oil> Natural Gas> Cement> Fertilizers
Recent findings
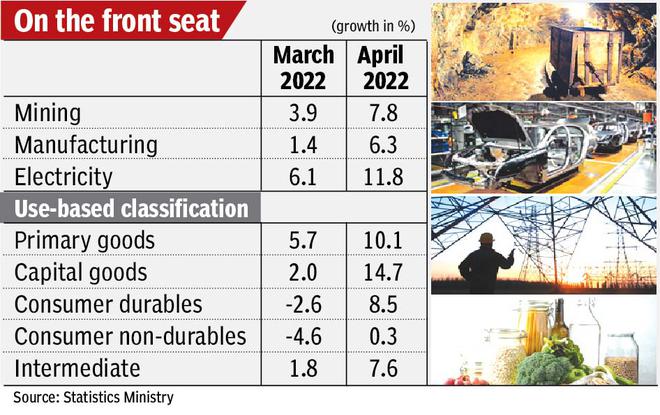
- The manufacturing sector recorded growth of 6.3% in the first month April 2022- current financial year.
- The previous high for IIP growth was 13% in August 2021.
- The power and mining sectors grew 11.8% and 7.8%, respectively.
- As per use-based classification, the capital goods segment recorded a growth of 14.7%, while consumer durables output expanded 8.5%.
- Output in Consumer non-durables sector is a reflection that consumers are wary to spend amid high inflation.
- Output for primary goods, intermediate goods, infrastructure/ construction goods, and consumer non-durables sectors expanded 10.1%, 7.6%, 3.8% and 0.3%, respectively.
- The low base of the second wave of COVID-19 bumped up the IIP growth to an 8-month high of 7.1% in April 2022.
|
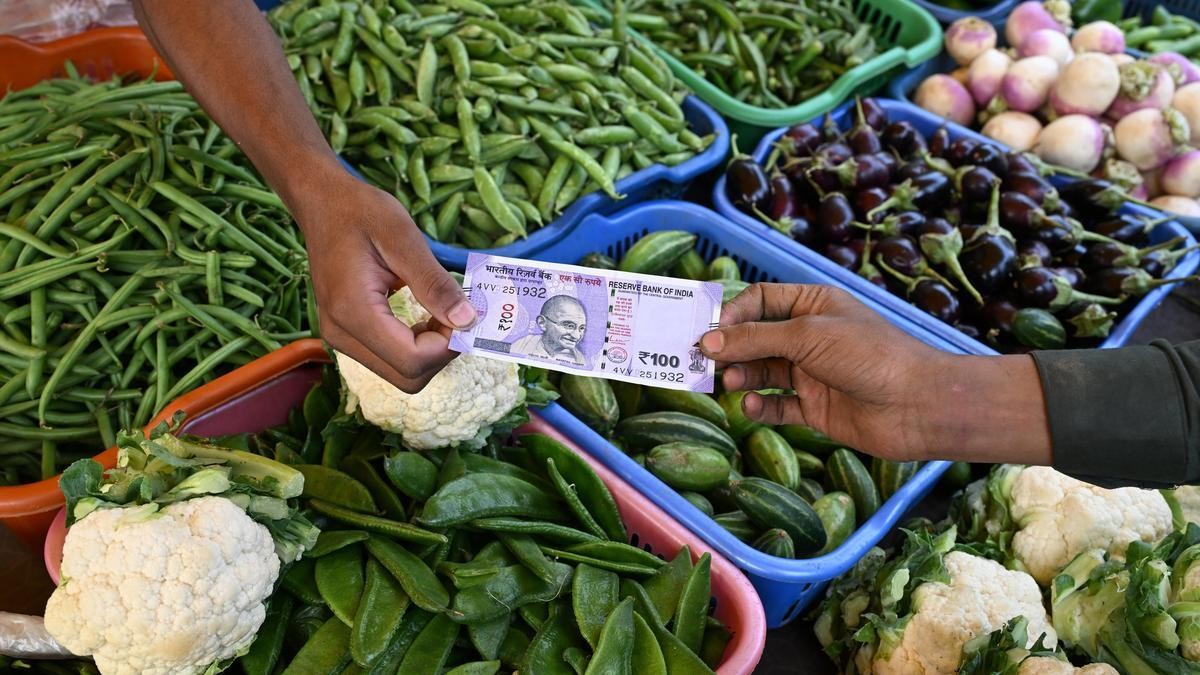
Base Effect
Base Effect is a term generally used in Inflation. It refers to the impact of an increase in the price level (i.e. previous year’s inflation) over the corresponding rise in price levels in the current year (i.e., current inflation).
If the inflation rate was low in the corresponding period of the last year, then even a small increase in the price index will give a high rate of inflation in the current year.
Similarly, if there is a rise in the price index in the corresponding period of last year and recorded high inflation, then an absolute increase in the price index will show a lower inflation rate in the present year.
Base Effect Example
Let’s assume - 200 as a Base Year and the index for 100 is 50. For 2019 it is 120. So the inflation rate is 20% and for 2019, it is 125. So comparing the previous year, the inflation rate for 2019 has risen by 5%. But the base effect for 2 years (2018-2019), the inflation rate has is risen by 25%.
|
https://www.thehindu.com/business/Economy/industrial-output-rose-to-8-month-high-of-71-in-april/article65515214.ece
1.png)