Description
Disclaimer: Copyright infringement not intended.
Context
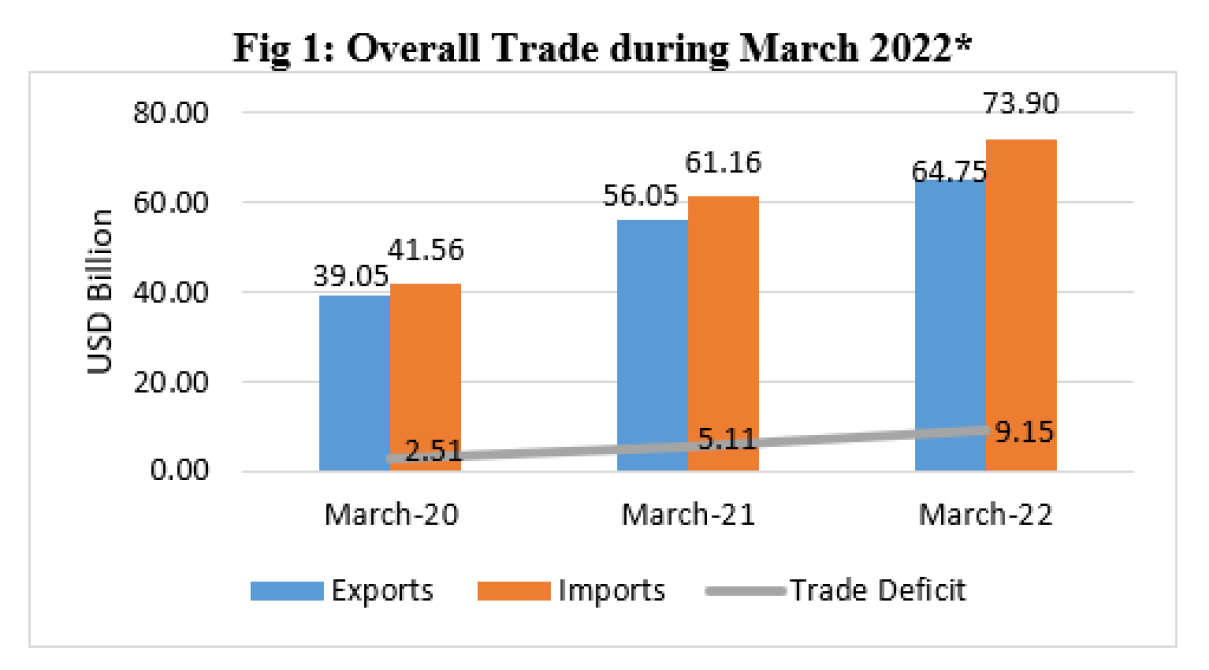
- India’s merchandise trade deficit widened to a record $23.33 billion in May 2022.
India’s International Trade: Overview
- In 2020 India was the number 6 economy in the world in terms of GDP (current US$), the number 18 in total exports, the number 12 in total imports, the number 150 economy in terms of GDP per capita (current US$) and the number 40 most complex economy according to the Economic Complexity Index (ECI).
- The top exports of India are Refined Petroleum ($25.3B), Packaged Medicaments ($17.8B), Diamonds ($16B), Rice ($8.21B), and Jewellery ($7.57B), exporting mostly to United States ($49.7B), China ($18.5B), United Arab Emirates ($18.1B), Hong Kong ($9.18B), and Germany ($8.8B).
- In 2020, India was the world's biggest exporter of Diamonds ($16B), Rice ($8.21B), Crustaceans ($3.95B), Non-Retail Pure Cotton Yarn ($2.61B), and Pepper ($1.16B)
Imports
- The top imports of India are Crude Petroleum ($59B), Gold ($21.9B), Coal Briquettes ($20.9B), Diamonds ($15.8B), and Petroleum Gas ($13.8B), importing mostly from China ($64.2B), United States ($26.6B), United Arab Emirates ($22.1B), Saudi Arabia ($16.8B), and Iraq ($14.4B).
- In 2020, India was the world's biggest importer of Coal Briquettes ($20.9B), Diamonds ($15.8B), Palm Oil ($5.04B), Soybean Oil ($3.02B), and Nitrogenous Fertilizers ($2.64B).
LATEST TRENDS
Overview
- In February 2022 India exported $37.1B and imported $57B, resulting in a negative trade balance of $19.9B. Between February 2021 and February 2022 the exports of India have increased by $9.61B (34.9%) from $27.5B to $37.1B, while imports increased by $16.5B (40.6%) from $40.5B to $57B.
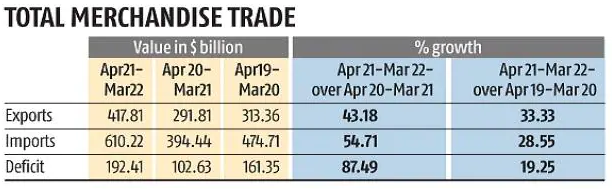
- In May exports grew 15.5% to $37.3 billion while imports jumped 56.1% to $60.62 billion, preliminary data from the Commerce and Industry Ministry show. The previous highest monthly trade deficit was November’s $22.91 billion.
- Goods exports shrank 7.2% from April’s $40.19 billion, resulting in the trade deficit for the first two months of 2022-23 widening to $41.73 billion. The figure for April-May 2021 was $21.82 billion.
- Petroleum exports, which surged 52.7% from May 2021, electronics (41.5%) and readymade textile garments (22.9%), led the export growth, the overall growth rate almost halved to an 8.1% pace once petroleum exports were excluded. May’s 15.5% pace was also the slowest in 15 months.
- This is the third month in a row that merchandise imports have crossed $60 billion, thanks to elevated commodity and oil prices amid the festering Russia-Ukraine conflict. Gold imports shot up almost ninefold year-on-year to cross $5.8 billion.
- Petroleum imports almost doubled to $18.1 billion while coal imports more than doubled from May 2021 levels to $5.33 billion.
Trade
- In February 2022, the top exports of India were Petroleum Products ($6.9B), Pearl, Precs, Semiprecs Stones ($2.42B), Iron And Steel ($1.76B), Drug Formulations, Biologicals ($1.5B), and Aluminium, Products Of Aluminm ($1.05B). In February 2022 the top imports of India were Petroleum: Crude ($13.3B), Gold ($4.78B), Petroleum Products ($3.53B), Pearl, Precs, Semiprecs Stones ($3.2B), and Coal,Coke And Briquittes Etc ($2.86B).
Destinations
- In February 2022, India exported mostly to United States ($6.17B), United Arab Emirates ($2.6B), Bangladesh ($1.59B), Netherlands ($1.44B), and China ($1.41B), and imported mostly from China ($8.51B), United Arab Emirates ($4.5B), United States ($4.46B), Saudi Arabia ($3.71B), and Iraq ($3.6B).
Growth
- In February 2022, the increase in India's year-by-year exports was explained primarily by an increase in exports to United States ($514M or 11.6%), South Africa ($494M or 166%), and Australia ($293M or 142%), and product exports increase in Pearl, Precs, Semiprecs Stones ($403M or 22.8%), Iron Ore ($275M or 109%), and Rice(Other Than Basmoti) ($267M or 150%). In February 2022, the increase in India's year-by-year imports was explained primarily by an increase in imports from Switzerland ($1.43B or 158%), China ($660M or 11%), and South Africa ($366M or 78.2%), and product imports increase in Gold ($2.45B or 155%), Pearl, Precs, Semiprecs Stones ($735M or 50.2%), and Vegetable Oils ($298M or 35.6%).
- With base effects catching up, the pace of growth of goods exports and then later, imports, is likely to moderate, while remaining high in absolute terms as commodity prices are seeing a renewed uptick,
https://epaper.thehindu.com/Home/ShareArticle?OrgId=GAG9SN28G.1&imageview=0
1.png)