Description
Context:
- Last two weeks saw a flurry of macroeconomic publications — the presentation of the Economic Survey for 2020-21, the Union Budget for 2021-22, and the first bi-monthly monetary policy review by the Reserve Bank of India.
- But this flood of information also hid something crucial — the First Revised Estimates (FRE) of GDP growth in 2019-20, which were released by the Ministry of Statistics and Programme Implementation (MoSPI) on January 29.
Background:
- In the past, we have seen how GDP revisions, even though a routine exercise, can be of importance, especially when the growth rate fluctuates significantly enough.
- The latest revisions have not only tweaked the GDP growth rates for 2019-20 but also recalibrated the GDP growth rates of two more years — 2017-18 and 2018-19.
- India’s GDP likely grew by just 4% in 2019-20 as against 4.2%.
- The MoSPI press release also dialled down the GDP growth rate for 2017-18 from 7% to 6.8%. However, for 2018-19, the GDP growth rate has now been moved up from 6.1% to 6.5%.
1: The extent of data revisions
- According to the First Advance Estimates for 2018-19 released on January 7, 2019, the GDP was to grow by 2%.
- Then Second Advance Estimates in February 2019 said the GDP would grow by 7%.
- The Provisional Estimates at the end of May 2019 pegged the GDP growth at 8%.
- Then the First Revised Estimates, released on January 31, 2020, revised the growth rate down to just 6.1%.
- Now the Second Revised Estimates for FY19 inform us that the GDP grew by 6.5%.
- To be sure, there are at least two more revisions left — the “third revised estimates” (another year down the road) and the “actuals” (two years hence).
2: The importance of India’s GDP in 2019-20
- The combined result of an 8% GDP contraction in the current year (2020-21) followed up by a (projected) 10%-11% GDP growth in the next financial year (2021-22) will be that, at the end of March 2022, the absolute level of India’s GDP will be almost the same as it was in March 2020.
- But as things stand, not just in 2019-20 data but also in GDP levels of preceding years — it would be hard to be sure of what India’s GDP was at the end of March 2020.
- The year 2019-20 is also significant for another reason. Since the Covid disruption hit the Indian economy only in the last week of March 2020, the overall GDP growth of 2019-20 provides a good measure of how weak/strong the Indian economy was going into the pandemic.
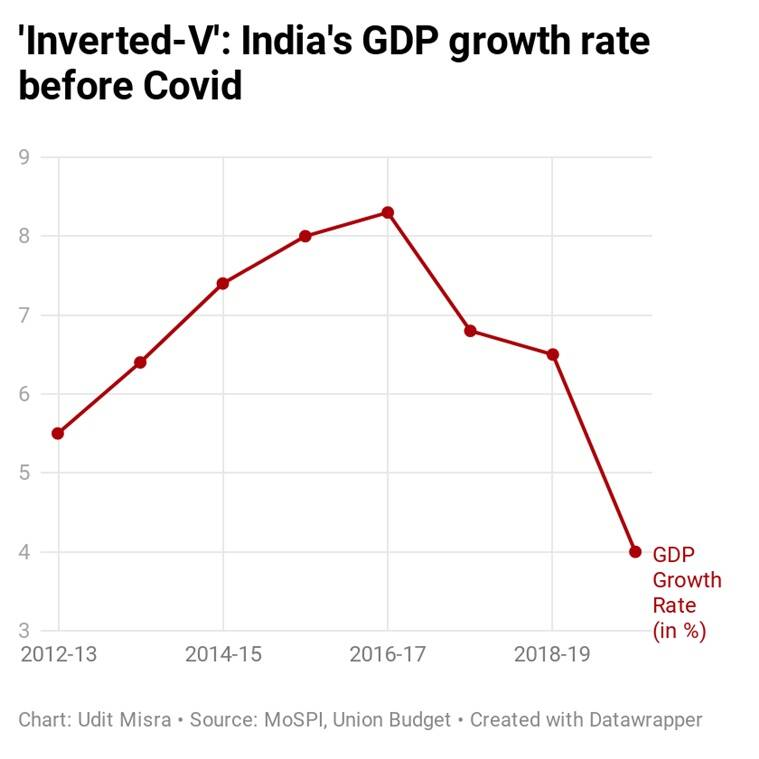
3: The “inverted-V” shape of India’s GDP growth rate during the past decade
- India’s GDP growth rate followed an “inverted-V” shape before Covid brought the economy down to a complete halt.
- The chart below gives a glimpse of the supply side of the economy. It maps the growth rate of the Gross Value Added (GVA) in India’s manufacturing sector.
- The manufacturing sector is possibly the most important sector for India as it has the capacity to absorb the maximum number of unemployed people in the country.
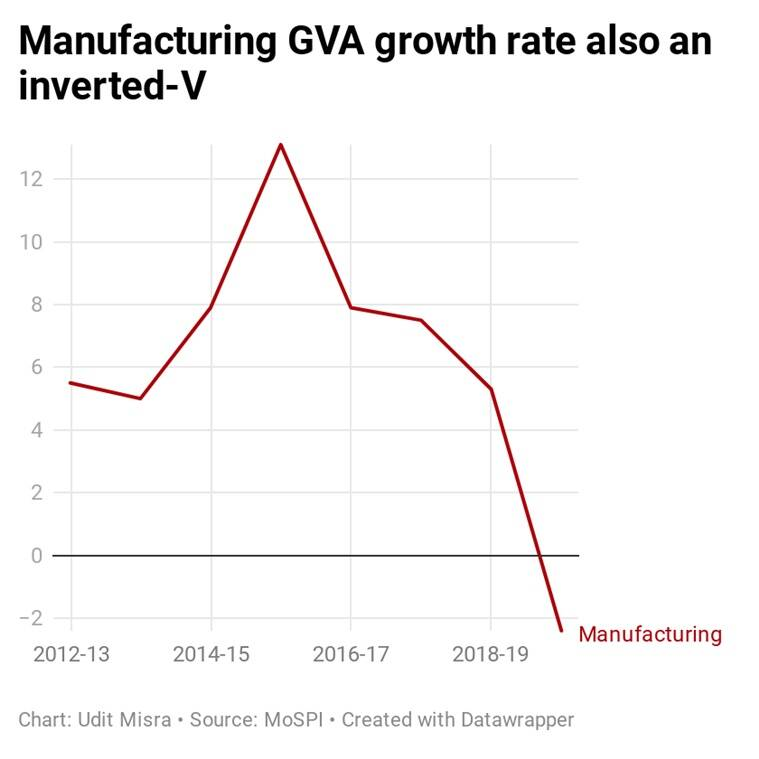
- There is much talk about India registering a “V-shaped” recovery in the next financial year (2021-22). But, what the data above suggests is a more broad-based loss of growth momentum in the economy before Covid.
- The likely gains in FY22 will only bring the economy at par with where it was at the end of FY20.
- In other words, the actual recovery — whatever be its shape — will start once India starts growing beyond the FY20 levels of GDP.
https://indianexpress.com/article/explained/inverted-v-the-shape-of-indias-gdp-growth-rate-over-the-past-decade-explainspeaking-7179161/