Description
Disclaimer: Copyright infringement not intended.
Context
- In recent times, several regions in North India, including Bihar, Uttar Pradesh, Uttarakhand, Haryana, Delhi, and Punjab, have been experiencing persistent heavy fog since December 2023.
- The India Meteorological Department (IMD) has been actively monitoring and issuing warnings related to the dense fog conditions.
Details
Types of Weather Satellites
- Geostationary Satellites (GEO): Orbit at an altitude of approximately 35,786 kilometers above the equator, allowing them to remain stationary relative to a specific point on Earth. They provide continuous monitoring of a specific region, such as a continent or an ocean.
- Polar Orbiting Satellites (PO): Orbit the Earth from pole to pole, providing global coverage. They operate at lower altitudes (typically 800-1,200 kilometers) and are crucial for collecting detailed information about the atmosphere, including temperature, humidity, and cloud cover.
Instruments and Sensors
- Visible and Infrared Sensors: Capture images of clouds, land, and ocean surfaces. They help identify cloud cover, storm systems, and surface temperatures.
- Microwave Sensors: Penetrate clouds to measure temperature and humidity levels in different layers of the atmosphere.
- Radiation and Energy Sensors: Monitor incoming solar radiation and outgoing thermal radiation to study energy balance in the atmosphere.
- Scatterometers: Measure wind speed and direction over the ocean by analyzing the backscattered signals from ocean surfaces.
Data Collection
- Satellites continuously collect data on various atmospheric parameters, including temperature, humidity, wind speed, cloud cover, and precipitation.
- This data is transmitted to ground stations, where it undergoes processing and analysis.

Applications
- Weather Forecasting: Satellites provide real-time data that improves the accuracy of short-term and long-term weather forecasts.
- Severe Weather Monitoring: Satellites help track hurricanes, typhoons, tornadoes, and other severe weather events, allowing for early warnings and evacuation planning.
- Climate Monitoring: Long-term satellite data contribute to the study of climate patterns, climate change, and the Earth's overall climate system.
Integration with Other Systems
- Satellite data is integrated with ground-based observations, weather balloons, and other sources to create a comprehensive understanding of atmospheric conditions.
- Numerical weather prediction models use satellite data as input to simulate and predict future weather patterns.
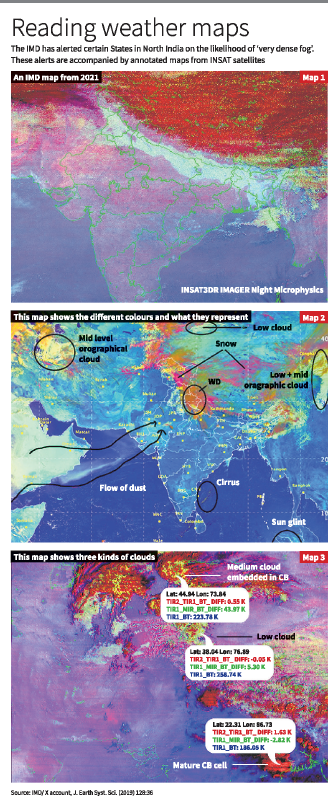
Color Representation on Weather Maps
- The colors on the weather maps from INSAT 3D satellite are determined by the solar reflectance and brightness temperature.
- Solar reflectance is the ratio of solar energy reflected by a surface to the incident solar energy, and brightness temperature relates to the temperature of an object and the corresponding brightness of its surface.
- Different wavelengths (0.5 micrometers, 1.6 micrometers, and 10.8 micrometers) are used to detect visible radiation, shortwave infrared radiation, and thermal infrared radiation, respectively.
Reading the Maps
- The color on each point of the image is determined by the strength of signals in these wavelengths.
- For example, green color represents the strength of the 0.5 micrometer visible signal, red color represents the strength of the 1.6 micrometer shortwave infrared signal, and blue color represents the strength of the 10.8 micrometer thermal infrared signal.
Tracking Snow
- The color scheme is designed to identify different cloud types, stages of thunderstorms, snow areas, and fire detection.
- Snow strongly absorbs radiation at 1.6 micrometers (shortwave infrared), causing the red component of the color scheme to become weak when the satellite tracks snow.
Night Microphysics
- Night microphysics involves the difference between two signals to determine colors.
- Red color is determined by the difference between two thermal infrared signals (12 micrometers and 10 micrometers).
- Green color varies based on the difference between a thermal infrared signal and a middle infrared signal (10.8 micrometers and 3.9 micrometers).
- Blue color is determined by the strength of a thermal infrared signal at 10.8 micrometers.
Applications of Color Scheme
- The color scheme helps analyze cloud types, thunderstorm stages, snow areas, and fire detection.
- By combining day and night microphysics data, scientists can track moisture droplets, temperature differences, and cyclone formation, evolution, and depletion.
Satellite Instruments
- Both INSAT 3D and INSAT 3DR use radiometers to make spectral measurements.
- Radiometers measure various properties of radiation, and atmospheric sounders on these satellites measure temperature, humidity, and water vapor at different heights.
Future Developments
- The upcoming INSAT 3DS satellite is expected to be launched in February 2024, with improvements in spatial resolution, spectral channels, and functionality.
India's Weather Satellites
- INSAT 3D and 3DR are currently active in geostationary orbits, aiding in weather monitoring.
- India has a history of launching progressively advanced weather satellites, with each new version being an improved and better-equipped iteration of its predecessor.
Conclusion
In conclusion, India's weather satellites, particularly INSAT 3D and 3DR, play a crucial role in monitoring and predicting various weather conditions, and the color-coded maps provide valuable insights into different atmospheric phenomena.
|
PRACTICE QUESTION
Q. Discuss the significance of color representation on IMD weather maps and explain the underlying principles of solar reflectance and brightness temperature. (250 Words)
|