Bare Necessities Index (BNI)
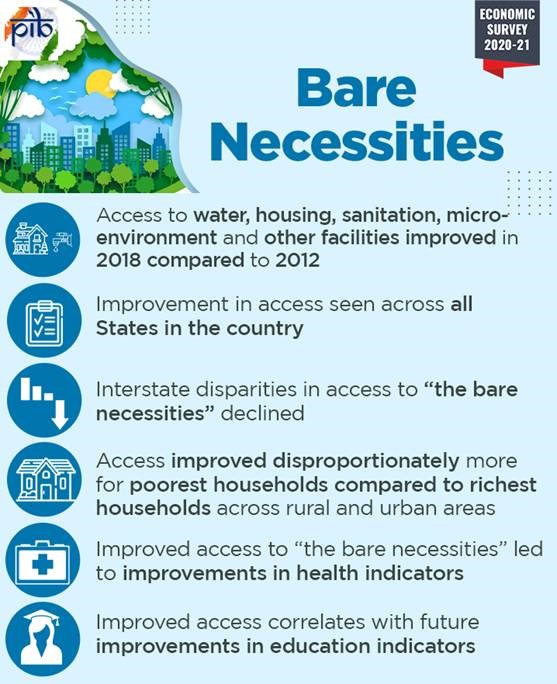
Context: Economic Survey 2020-21 underlined the importance of access to bare necessities of housing, water, sanitation, electricity and clean cooking fuel which are consumed by all the members of the household and which touch the life of every member.
Bare Necessities Index (BNI)
- Economic Survey 2020-21 constructs a Bare Necessities Index (BNI) at the rural, urban and all India level.
- The BNI summarises 26 indicators on five dimensions, water, sanitation, housing, micro-environment, and other facilities.
- The BNI has been created for all States for 2012 and 2018 using data from two NSO rounds, 69th and 76th on Drinking Water, Sanitation, Hygiene and Housing Condition in India.
- Economic Survey says that the “basic needs” approach to economic development focuses on minimum specified quantities of basic necessities such as food, clothing, shelter, water and sanitation that are necessary to prevent ill health and under nourishment.
- The Bare Necessities Index (BNI) is an attempt to quantify this approach to economic development using data from National Statistical Office (NSO).
- It is created for all States/Union Territories by employing data at State Level.
- State-wise values of BNI in 2012 and 2018 for India (rural + urban), are shown in Figures.
- A higher value indicates better access to bare necessities in a State.
- The three colours, green, yellow and red, used in the maps show the level of a State in providing access to bare necessities to its households.
- Green (above 0.70) indicates ‘High’ level and is therefore the most desirable, followed by yellow (0.50 to 0.70), which indicates ‘Medium’
- In contrast, Red (below 0.50) indicates very ‘Low’ level of access.
- The difference in colours in a map indicate the regional variation in the access to bare necessities for the households.
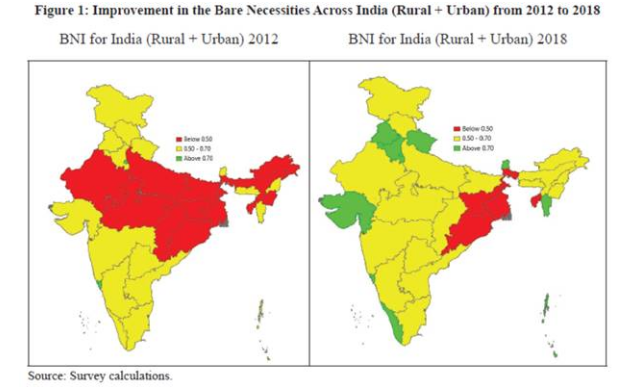
- It is quite evident that in most of the States the access to the Bare Necessities for the household in 2018 is significantly better compared to 2012.
- Economic Survey also underlines that due to the constant efforts made by the Government through network of schemes like Swachh Bharat Mission, National Rural Drinking Water Programme, Pradhan Mantri Awas Yojana, Saubhagya and Ujjwala Yojana access to bare necessities have improved in 2018 across all States in the country compared to 2012.
- Inter-State disparities in the access to the bare necessities have declined and access has improved disproportionately for the poorest household when compared to the richest household across rural and urban areas.
https://pib.gov.in/PressReleasePage.aspx?PRID=1693202
1.png)