The economic cost of being ‘filthy India’
Context: US President Donald Trump referred to it as “filthy India” during the final presidential debate and India received a lot of unwanted attention.
How much “filthy” is India when compared to other countries?
- According to “Our World in Data”, part of Oxford University, “an estimated 775,000 people died prematurely as a result of poor sanitation in 2017.
- “This was 1.4% of global deaths. In low-income countries, it accounts for 5% of deaths,”.
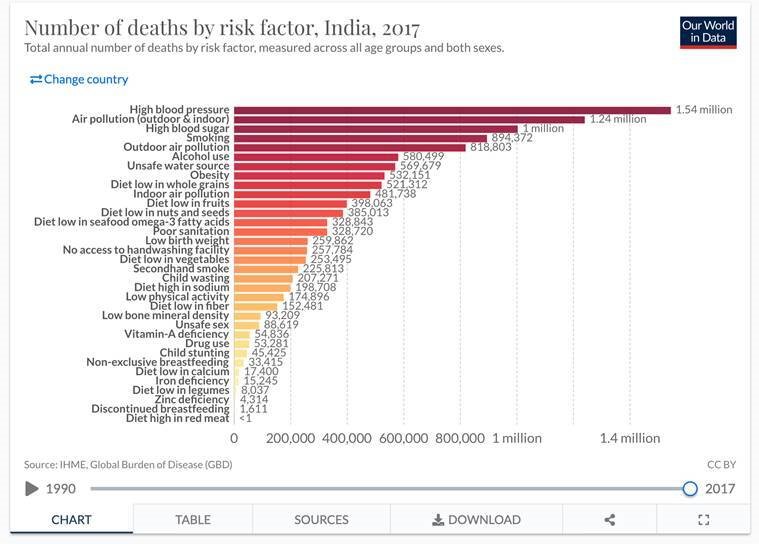
- “Air pollution” — both indoors and outdoors — as well as “poor sanitation, unsafe water sources, and no access to hand washing facilities” compete with risks due to high blood pressure, high blood sugar and smoking.
The annual number of deaths by risk factors in India
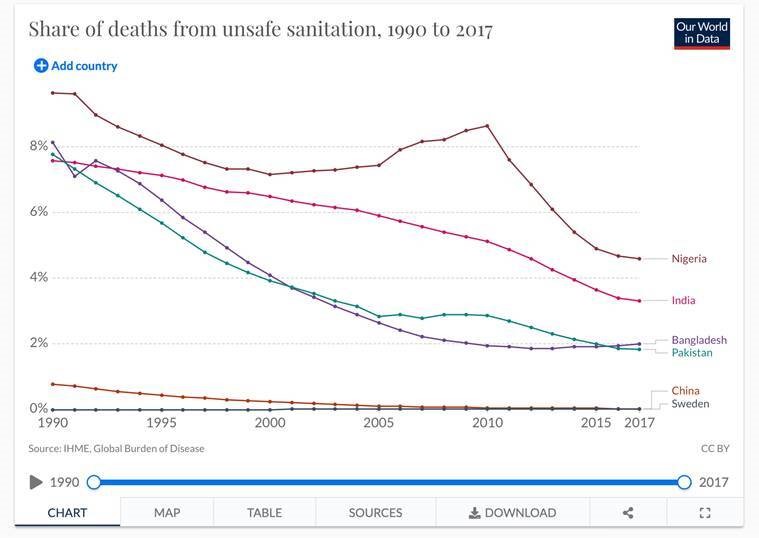
- The chart below shows how the share of deaths due to unsafe sanitation has changed over the years.
- In India, this share has been higher than its neighbours such as Bangladesh and Pakistan.
Share of deaths due to unsafe sanitation
- Further, while the share has been falling in India yet the pace has slowed down a bit since 2015. according to the Global Disease Burden study — published in Lancet — by the Institute for Health Metrics and Evaluation (IHME).
- The reason why so many die from unsafe sanitation is that, in India, a high proportion of the population does not have access to “improved sanitation”.
- Improved sanitation is defined as facilities that “ensure hygienic separation of human excreta from human contact”.
- This includes facilities such as flush/pour flush (to piped sewer system, septic tank, pit latrine), ventilated improved pit (VIP) latrine, pit latrine with slab, and a composting toilet.
- In 2015, 68% of the world population had access to improved sanitation facilities. In other words, almost one-third of people did not have access.
- In India, only 40% of the population had access to improved sanitation. This is much lower than its next-door neighbours such as Sri Lanka (95%) and Pakistan and Bangladesh (both over 60%).
- At 40% access, India is clubbed with countries such as Zimbabwe and Kenya, and is below countries such as Zambia and Senegal.
- While the broader trend is that access to improved sanitation increases with higher levels of income, Pakistan, Bangladesh, Rwanda and Nepal have achieved better access at lower levels of per capita GDP than India.
Share of population with improved sanitation vs. GDP per capita, 2015
- Overall, poor sanitation and pollution have significant adverse impacts on public health standards.
- Child stunting — which means having a lower height for one’s age— is a sign of chronic malnutrition and data shows that stunting is higher in countries (such as India) where access to improved sanitation is low.
Prevalence of stunting vs. improved sanitation facilities, 2015
- According to the World Bank: “A lack of sanitation also holds back economic growth.
- Poor sanitation costs billions to some countries”.
- In India’s case, the most oft-quoted study is a World Bank one from 2006 when such costs were pegged at $53.8 billion or 6.4% of India’s annual GDP.
- Even if this percentage (of GDP) has stayed the same, at current-day GDP, the losses (a rough approximation) would be close to $170 billion (or Rs 12 lakh crore).
- “The economic losses are mainly driven by premature deaths, the cost of health care treatment, lost time and productivity seeking treatment, and lost time and productivity finding access to sanitation facilities,” according to the World Bank.
- According to the World Health Organization, “every dollar spent on sanitation yields about $9 in savings on treatment, health-care costs and gains from more productive days”.
1.png)